Анализ фильмов с платформы Netflix
Описание
В современном мире Netflix стал настоящей сокровищницей для любителей кино. Каждый здесь может что-то на свой вкус. Но вы никогда не задумывались, как именно выбираются эти фильмы, какие тренды и жанры доминируют на платформе, и как их популярность меняется со временем? Рассмотрим этот вопрос.
На сайте Kaggle был выбран самый актуальный датасет для анализа. Эти данные предоставляют подробную информацию о фильмах, включая жанры, бюджеты, доходы, страны производства и описания. Проанализировать именно эти данные, стоит так как они позволяют выявить важные тренды, которые могут повлиять на успех фильма.
В итоговом варианте было решено использовать 4 типа графиков, а именно: Гистограмма Облако слов Диаграмма рассеяния Круговая диаграмма
График 1
График № 1 — Самые актуальные жанры
Круговая диаграмма жанров позволяет наглядно увидеть, какие жанры преобладают среди фильмов Netflix, что поможет составить итоговое мнение по самым живучим жанрам, которые даже спустя 15 лет остаются в тренде. Для начала убираем все жанры, у которых процент меньше 3,5%, переносим их в категорию Other. Через deep_translator переведём названия жанров на русский язык и отобразим в круговой диаграмме
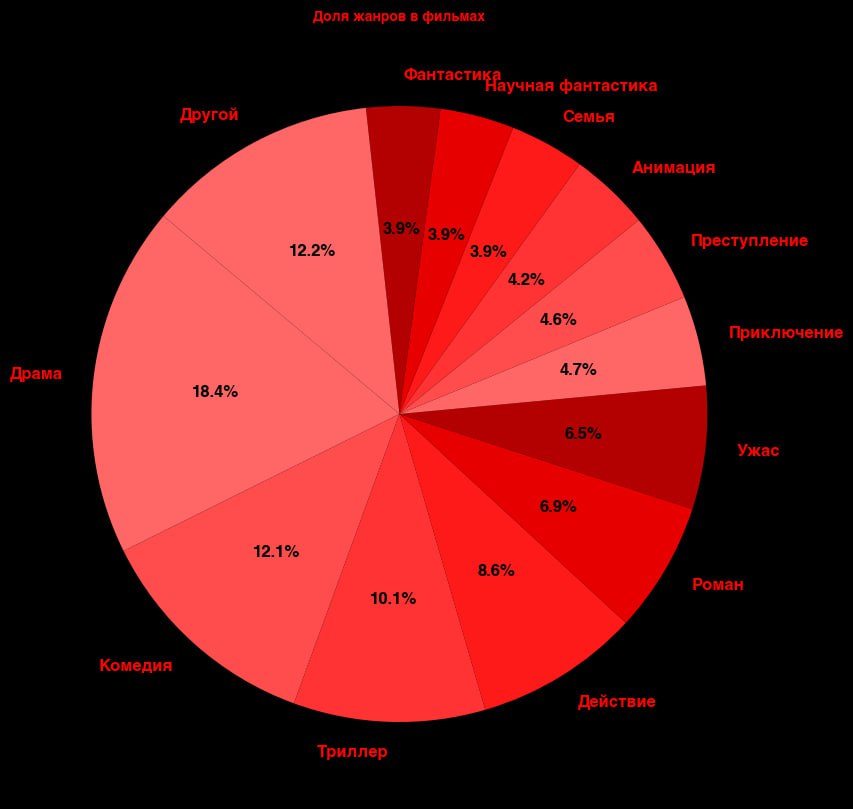
график 1
from deep_translator import GoogleTranslator
data['genres'] = data['genres'].str.replace (', ', '') genres_count = data['genres'].str.split (', ').explode ().value_counts ()
top_genres = genres_count[genres_count > 0.035 * genres_count.sum ()] top_genres['Other'] = genres_count[genres_count <= 0.035 * genres_count.sum ()].sum ()
translator = GoogleTranslator (source='en', target='ru') translated_genres = {genre: translator.translate (genre) for genre in top_genres.index} top_genres.index = [translated_genres[genre] for genre in top_genres.index]
red_colors = ['#ff6666', '#ff4d4d', '#ff3333', '#ff1a1a', '#e60000', '#b30000']
plt.figure (figsize=(10, 10))
wedges, texts, autotexts = plt.pie ( top_genres, labels=top_genres.index, autopct='%1.1f%%', startangle=140, colors=red_colors, textprops={'fontproperties': bold, 'fontsize': 12} )
plt.gcf ().set_facecolor ('black')
for text in texts: text.set_color ('red')
for autotext in autotexts: autotext.set_color ('black')
plt.title ('Доля жанров в фильмах', fontsize=32, fontproperties=bold, color='red')
plt.show ()
график 2
График № 2 — Связь бюджета и дохода
Диаграмма рассеяния, показывающая связь между бюджетом и доходом, помогает понять, как инвестиции в производство могут повлиять на кассовые сборы. Будем использовать столбцы budget и revenu, отобразив их в scatter графике.
plt.figure (figsize=(10, 6), facecolor='black') ax = plt.gca () ax.set_facecolor ('black')
plt.scatter (data['budget'], data['revenue'], alpha=0.5, color='red')
plt.xscale ('log') plt.yscale ('log')
plt.xlabel ('Бюджет', fontsize=14, color='red', fontproperties=regular) plt.ylabel ('Доход', fontsize=14, color='red', fontproperties=regular) plt.title ('Связь бюджета и дохода фильмов', fontsize=32, color='red', fontproperties=bold)
ax.spines['bottom'].set_color ('red') ax.spines['left'].set_color ('red') ax.spines['top'].set_color ('red') ax.spines['right'].set_color ('red') ax.tick_params (axis='x', colors='red') ax.tick_params (axis='y', colors='red')
plt.grid (True, color='gray', linestyle='--', linewidth=0.5)
plt.show ()
график 3
График № 3 -Топ-10 режиссёров по среднему доходу фильмов Топ-10 режиссёров по доходу фильмов подчеркивает, какие личности оказывают наибольшее влияние на финансовый успех. Ведь именно режиссёр является основоположник
top_directors = data.groupby ('director')['revenue'].mean ().nlargest (10)
plt.figure (figsize=(12, 6), facecolor='black') ax = plt.gca () ax.set_facecolor ('black')
top_directors.sort_values ().plot (kind='barh', color='red', ax=ax)
plt.xlabel ('Доход (в млрд. долларов)', color='red', fontproperties=bold) plt.ylabel ('Режиссёр', color='red', fontproperties=bold) plt.title ('Топ-10 режиссёров по среднему доходу фильмов', color='red', fontproperties=bold)
plt.grid (axis='x', linestyle='--', alpha=0.5, color='red')
ax.spines['bottom'].set_color ('red') ax.spines['top'].set_color ('red') ax.spines['left'].set_color ('red') ax.spines['right'].set_color ('red') ax.xaxis.label.set_color ('red') ax.yaxis.label.set_color ('red') ax.tick_params (axis='x', colors='red') ax.tick_params (axis='y', colors='red')
for label in ax.get_yticklabels (): label.set_fontproperties (regular) label.set_color ('red')
plt.show ()
график 4
График № 4 — Облако слов по описанию
Облако слов из описаний фильмов выявляет наиболее часто встречающиеся темы и ключевые слова. Для отображения облака все слова из описания объединим в единую строку и выведем облако на экран.
from wordcloud import WordCloud
actors_text = " «.join (data['description'].dropna ())
def red (word, **kwargs): return „red“
wordcloud = WordCloud ( width=1000, height=500, background_color='black', font_path="helvetica_bold.otf», color_func=red ).generate (actors_text)
plt.figure (figsize=(12, 6)) plt.gcf ().set_facecolor ('black') plt.imshow (wordcloud, interpolation='bilinear') plt.axis ('off') plt.title ('Облако слов по описанию', fontsize=32, color='red', fontproperties=bold) plt.show ()
график 5
График № 5 — Топ-15 стран по количеству фильмов
Этот график позволяет увидеть, в каких странах создается больше всего контента для платформы и не только. Совместные работы стран (Канада + США) были оставлены, чтобы показать, где доля рынка бралась совместно, а где в одного.
from deep_translator import GoogleTranslator
country_counts = data['country'].value_counts ().head (15)
translated_countries = [GoogleTranslator (source='en', target='ru').translate (country) for country in country_counts.index] country_counts.index = translated_countries
plt.figure (figsize=(10, 6), facecolor='black') ax = country_counts.plot (kind='barh', color='red')
ax.set_facecolor ('black')
plt.title ('Топ-15 стран по количеству фильмов', fontsize=20, color='red', fontproperties=bold) plt.xlabel ('Количество фильмов', fontsize=14, color='red', fontproperties=bold) plt.ylabel ('Страна', fontsize=14, color='red', fontproperties=bold)
plt.gca ().invert_yaxis ()
ax.spines['left'].set_color ('red') ax.spines['bottom'].set_color ('red') ax.tick_params (axis='x', colors='red') ax.tick_params (axis='y', colors='red')
for label in ax.get_yticklabels (): label.set_fontproperties (regular) label.set_color ('red')
plt.show ()


