В последние годы климат на Земле заметно меняется. Последние десятилетия были самыми теплыми за всю историю наблюдений, и каждое из последних четырех десятилетий было теплее, чем любое предыдущее десятилетие с 1850 года. Мы не видим СО2. Это не видимая угроза, но вполне реальная и серьездная для всего человечества.
Работа над проектом началась с сбора данных, нахождения таблицы, её загрузки в программу для дальнейшей визуализации и анализа данных.
Структура плаката
Серия плакатов исследует статистику средних годовых температур в 15 странах с 2000 по 2024, численности населения, выброса СО2 на душу населения, изменения уровня моря, площади лесов, погодных условий, возобновляемой энергии.
Разные значения складываются в уникальные паттерны
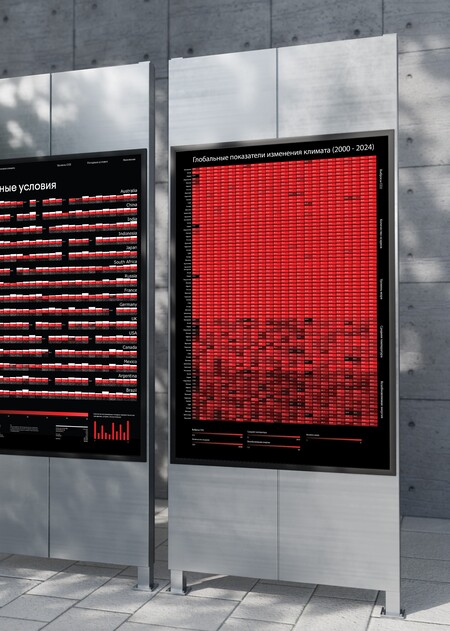
Общие показатели климата
Серия плакатов с визуализацией общих показателей и факторов влияющих на изменение мирового климата.
Структура плаката
Плакат с визуализацией-паттерном с средними значениями изменения факторов, влияющих на глобальное потепление с 2000 по 2024. Значения имеют цветовую кодировку.


